Diving deep into ocean data uncovers ‘missing heat’ treasure
March 30, 2013 — andyextance
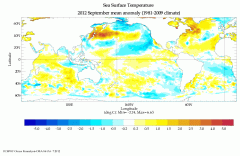
A new ocean reanalysis called ORAS4, here showing the difference between September 2012 sea temperatures and the average for 1989-2009 (not part of the latest study), has helped show that extra heat trapped in the atmosphere by CO2 humans are emitting is buried in the deep ocean. Credit: ECMWF
A newly-made picture of ocean history has backed a theory that the missing piece of a climate puzzle at the edge of space lies deep in Earth’s waters. The puzzle comes because the amount of heat energy our planet has absorbed should have warmed it more than it seems to have done. But now, using an ocean reanalysis assembled from data gathered from many sources, UK and US researchers have shown especially strong recent warming in oceans below 700m. “We have found some energy buried at depths,” Kevin Trenberth from the National Center for Atmospheric Research (NCAR) in Boulder, Colorado. “We also have a plausible explanation for it related to changes in winds.”
In 2010, Kevin went public over his worries about a budget that didn’t balance. But rather than money, that budget tallies heat energy from the Sun entering the top of the atmosphere against energy the Earth radiates back out into space. Satellite measurements show more energy coming in than leaving, which is what causes global warming. But Kevin noticed that existing measurements showed the world hadn’t warmed as much since 2003 as this budget would suggest.
With over nine-tenths of the surplus energy coming into the Earth going into the sea, the deep ocean has always looked the likeliest hiding place for the missing heat. However, temperature data from those depths is scarce, making the theory hard to prove. Yet, in the years since Kevin pointed out the problem, scientists have gathered some clues to back that explanation. For example, some used a model that includes the complex links between the atmosphere, land, oceans, and sea ice to run five simulations of the 21st century. They found warming slowdowns on the Earth’s surface similar to what has happened in the 2000s, with the heat going into the deep oceans. But even this just underlined the importance of using measurements to see the effect directly.
Deep thought
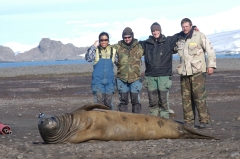
While this scene might get Dr Evil excited, it actually helped produce valuable, scarce ocean data. Scientists have glued instruments to elephant seals to take measurements difficult to get by other means. It has now helped reveal where “missing heat” from the Earth’s energy budget has gone – and though the seal looks distinctly nonplussed, the instrument will fall off when it next moults. Credit: NOAA
Scientists have been so desperate for ocean data that they have even resorted to gluing instruments to bemused elephant seals. But in recent years a fleet of thousands of ‘Argo’ floating data recorders have revolutionised ocean watching. Meanwhile, ocean reanalyses attempt to fill in historical ocean data gaps bringing together all the available forms of ocean data, along with energy and water flows from the atmosphere. By combining the data with a model element, the reanalyses produce maps of salt content, or salinity, heat and water flows that can form the basis of seasonal weather forecasts. Though these reanalyses would seem to be ideal for studying heat in the ocean, Kevin underlined that the modelling can bias results. The short timescales they normally look at are also quite different from what’s used in climate studies.
But last year, scientists at the European Centre for Medium-Range Weather Forecasting (ECMWF) in Reading, UK, published their ORAS4 ocean reanalysis system. Every 10 days it combines the output of an ocean model with observations from all the available sources, including elephant seals and Argo floats. As such it provides a historical picture from sea level, ocean temperature, and salinity data reaching back to 1958. It also boasts the latest ways to deal with bias and uncertainty. “ORAS4 is the most comprehensive ocean analysis available and, although it has some known problems, it is state of the art,” Kevin explained.
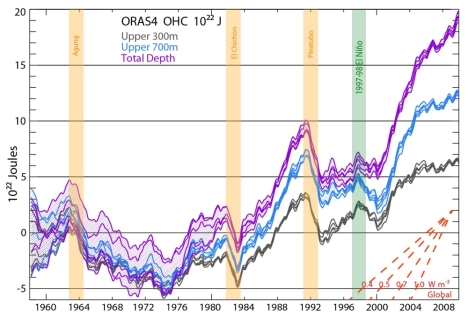
That prompted Kevin to team with Magdalena Balmaseda and Erland Källén from ECMWF to look at what the ORAS4 reanalysis said about the missing heat problem. In a paper published online in Geophysical Research Letters last week they find steady ocean warming since 1975, pierced by short, sharp cooling episodes. Two cooling episodes follow eruptions of the El Chichón and Mount Pinatubo volcanoes, whose ash cooled the Earth by reflecting the Sun’s energy into space. “The volcanic signals are the most realistic of any ocean dataset,” Kevin said.
Backing uncertainty into a corner
The especially powerful 1998 El Niño, warmed the world, cooled its seas, and washed several homes above Gleason Beach, California, down the cliff. Credit: SP8254 via Flickr Creative Commons license
A surprising extra cooling also came following 1998, probably due to the 1997–98 El Niño climate pattern. That El Niño helped make 1998 the year with Earth’s warmest surface temperatures by moving heat from the sea to the air. And ORAS4’s data on the different levels of the ocean revealed “profound” differences. Warming is speeding up below 700m, where most previous studies couldn’t reach, while it seems the heat content in the upper 300m has stabilised. About one third of ocean warming has occurred in deep waters in the last decade.
Kevin thinks that while some of this “deep heat” comes back up in the next El Niño, a lot of it doesn’t. Instead, it stays as part of the overall balancing, or equilibration, of heat through the climate. “It speeds that process up faster than assumed almost everywhere in climate research, and it invalidates simple energy balance climate models,” he said. “It means less short term warming at the surface but at the expense of a greater earlier long-term warming, and faster sea level rise. It also means that the current hiatus in surface warming is transient and global warming has not gone away.”
To check this data and the effect of various factors on them, Kevin and the ECMWF researchers also prepared a separate, modified, ORAS4. First, to test whether the deep ocean warming they saw was a result of the Argo floats’ launch, they removed that data. The modified reanalysis showed the same deep heat pattern, only weaker. They also tried suppressing year-to-year wind variability, and found heat staying in the upper 300m, the El Niño signal disappears, and the warming reverses after 2006. They suggested that this reveals how the heat moves. “The cause of the change is a particular change in winds,” Kevin said. “Especially in the Pacific Ocean, the subtropical trade winds have become noticeably stronger, thereby increasing the subtropical overturning in the ocean and providing a mechanism for heat to be carried downwards.”
Yet work remains to be done in properly balancing the energy budget. Kevin says that year-to-year changes still don’t work out well enough, and the problem could be in the ocean or at the edge of space. “Future work will explore this further when we look at rates of change of ocean heat content for direct comparison with top-of-atmosphere radiation measurements,” he said.
Ocean heat content in regions from 0 to 300 m (grey), 700 m (blue), and total depth (violet) from ORAS4, each with five lines as ORAS4 is an ensemble with five parts. Yellow bars are volcanic eruptions, and the green bar is the 1997-1998 El Niño. The graph is shown with respect to an 1958–1965 base period whose average heat value provides the zero baseline for the graph. The red lines in the corner show the rate of warming different slopes of the lines in the graph would mean. Figure © Wiley, used with permission, see citation below
Journal reference:
Magdalena A. Balmaseda, Kevin E. Trenberth, Erland Källén (2013). Distinctive climate signals in reanalysis of global ocean heat content Geophysical Research Letters : 10.1002/grl.50382


