Global view answers ice age CO2 puzzle
April 4, 2012 — andyextance

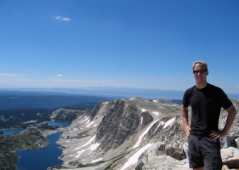
Paleoclimate researcher Jeremy Shakun. Credit: Harvard University
Previous data suggesting that the world started warming out of the last ice age before CO2 levels in the atmosphere started rising don’t show the full picture. That’s according to US, French and Chinese scientists who have added to those Antarctic measurements with more taken from 80 locations across the globe. Harvard University’s Jeremy Shakun and colleagues show the greenhouse gas rises before temperature, supporting the case that CO2 drove climate change then, as it is now. “This provides a very tangible example of what rising CO2 can mean for the climate over the long term,” Jeremy said.
In the 1980s, researchers began building the history of CO2 in the atmosphere from cylinders of ice drilled from the Antarctic. Bubbles in the ice contain air from the time they formed, which researchers can measure. They can also figure out how old the ice holding the bubbles is from how deep it is in the core. And finally they can also work out temperature from the amount of the different forms, known as isotopes, of elements like hydrogen, carbon and oxygen in the ice. That’s because the temperature at which the snow that eventually became the ice formed affects how much of each it contains. And because some isotopes are radioactive and decay to a more stable isotope with time, studying them gives scientists another way to check the ice’s age.

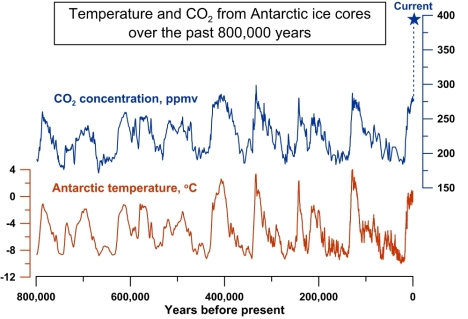
The 800,000 year record of atmospheric CO2 from Antarctic ice cores, and a reconstruction of temperature based on hydrogen isotopes in the ice. The current CO2 concentration of 392 parts per million (ppm) is shown by the blue star. Credit: Jeremy Shakun/Harvard University
Such methods show temperature and CO2 levels rising and falling together for 800,000 years, Jeremy told journalists over the phone on Tuesday. “The question is: Which is the cause and which is the effect?” he asked. “If you look up close you see temperature changed before CO2 did. This is something the global warming skeptics have jumped on to say, ‘Obviously CO2 doesn’t cause warming because it came after the warming in these records’. But these ice cores only tell you about temperatures in Antarctica. For the same reason that you don’t look at just one thermometer from London or New York to prove or disprove global warming, you don’t want to look at just one spot in the map to reconstruct the past either.”
Expert timing
Therefore, the scientists gathered proxy – or indirect – temperature records from all over the world from 20,000 to 10,000 years ago that cover the end of the last ice age. But they had to be careful about which proxies they chose to provide an accurate picture of what happened. “We didn’t pull in any records that only have a data point every thousand or two thousand years, as that would just be too fuzzy,” Jeremy said. “We also tried to pick records where the timing is pinned down.”

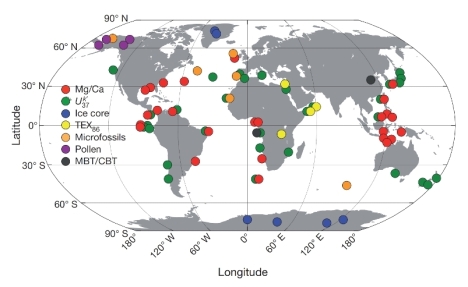
Location map and type of the 80 proxy methods brought together by Jeremy and his colleagues. Credit: Nature
As well as the ice cores, Jeremy and his colleagues also used similar cores other scientists had drilled containing tiny shells from the seabed and pollen from lake bottoms. In the first, the amount of magnesium in plankton shells living in the sea depends on temperature. As the plankton die the shells sink to the ocean bed, layering up over time, and when scientists retrieve cores they can check magnesium levels to get historical temperatures. Pollen in lake beds shows which plants were at the water’s edge, and the mixture of plants growing depends on temperature. The scientists date each temperature measurement using radioactive carbon decay.
Published in top research journal Nature on Wednesday, the compiled record shows a different picture to the Antarctic ice cores alone. “Our global temperature record looks a lot like the pattern of rising CO2 at the end of the ice age,” Jeremy said. “The interesting part in particular is that unlike these Antarctic ice core records we find that global temperature lags a bit behind CO2. You put these two points together and it really leaves you thinking that CO2 was the big driver for warming.”
A bigger picture
 Atmospheric CO2 (green line and scale) versus Antarctic temperature (red line and scale) and global temperature (blue dots and scale). Global temperature is linked to and generally lags behind CO2, unlike Antarctic temperature. ppmv stands for parts per million by volume. As the Antarctic temperature is an average of five records its is shown in standard deviation units (σ) rather than degrees. Credit: Harvard University/Jeremy Shakun
The patterns of change Jeremy’s team’s proxy data showed across the world also help understand why temperature began to rise before CO2 in Antarctica. They had to consider that CO2 doesn’t lead the world into and out of ice ages. Instead, constant patterns of small changes in how near the Earth’s orbit goes to the Sun is that pacemaker. Jeremy said that increases in the energy reaching the Earth when its orbit is nearer the Sun started to melt the ice covering the planet around 20,000 years ago. “That dumps freshwater into the North Atlantic, which slows ocean circulation, causing warming in the south and cooling in the north,” he said. “That’s the first warming in Antarctica. That starts to cause changes around the Southern Ocean, melting sea ice back, changing the winds, and leading to the venting of CO2 out to the atmosphere from the sea.”
But while it took 7000 years for CO2 levels to rise at the end of the ice age, humans have caused a sharp increase in just a century by burning fossil fuels. And though what that does will become clear slowly, it will stay with us for many centuries more, Jeremy underlined. “Over the end of the ice age the CO2 level rose from about 180 ppm to about 260 ppm,” he said. “Today we’re at 392 ppm, and we’ve gone up about 100 ppm in the past 100 years. Raising the concentration at the end of the ice age had a huge effect on global climate, and we’ve raised it as much. And we’ll probably be going up several hundred more this century.”
Comments (0)
You don't have permission to comment on this page.