Shrinking Arctic ice area is just the tip of the iceberg
June 25, 2011 — andyextance

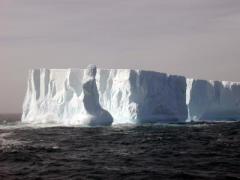
Like icebergs, much of the mass of Arctic ice lies under the surface, making studying its thickness important, as well as the area it covers. Credit: Florida State University
A sheer white glacial mountain apparently floating on the sea emerges from the freezing mists. A lone lookout cries “Iceberg!”, stirring the crew into panic, before the stomach-churning sound of ripping metal sends them to the lifeboats. It’s a familiar scene from the TV and movies, and one where the main threat comes because eight-ninths of a typical iceberg lies below the waterline. While sea ice formed from ocean water is much thinner than such glacier ice,
its thickness also lies mostly beneath the surface. Consequently, knowing its thickness is “perhaps the most basic measure of how the ice is responding to climate change”, according to the University of Colorado’s James Maslanik. Although it’s possible to track the area that the Arctic ice cap covers from space, knowing the depth it reaches is harder. “While the European Space Agency has just launched Cryosat-2 to measure thickness, the US no longer has a satellite operating that is capable of directly measuring ice thickness from space,” the scientist explained.
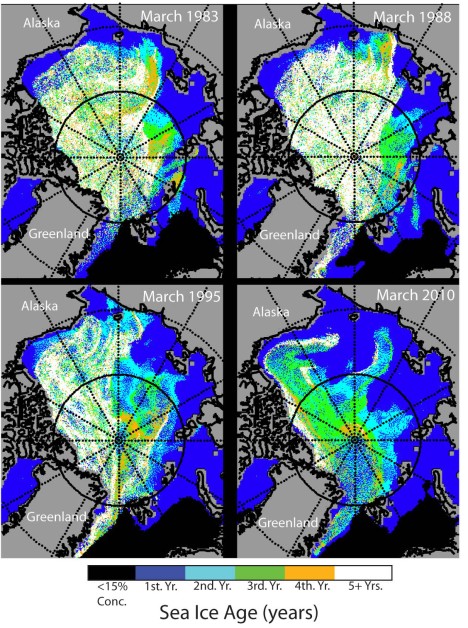
To tackle this problem, Maslanik and Colorado colleagues Julienne Stroeve, Charles Fowler, and William Emery have turned to assessing how many summer melt periods the ice is surviving. Maslanik says not only is this closely linked to ice thickness, it also reflects the influence of many climate- and weather-related factors. Ice that survives one summer melt is called “multi-year ice”. In a Geophysical Research Letters paper soon to be published, they find that multi-year ice makes up 45 per cent of the total Arctic ice cover in 2011, down from about 75 per cent in the mid 1980s. The proportion of ice older than five years fell from 50 per cent of all ice that has survived more than one summer to 10 per cent in the same period.
“The work of our Colorado group and other researchers clearly shows extreme decreases in the area of the Arctic Ocean covered by the oldest and thickest sea ice types,” Maslanik told Simple Climate. “This loss has accelerated in recent years, and while we continue to search for factors such as natural variability that could account for the changes, the effects of large-scale warming in the Arctic, including changes in the Arctic Ocean itself, are the most likely drivers for the loss in the old sea ice.”
Following up clues

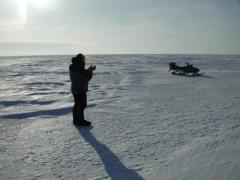
Thick, multiyear Arctic sea ice is disappearing, giving way to thin, young ice, according to University of Colorado at Boulder scientists. Credit: James Maslanik, University of Colorado
Maslanik’s desire to understand whether the age of Arctic ice has been changing was driven by two separate clues. “One of those was work I did early on at sea ice camps, which typically are set up on the oldest and thickest sea ice floes,” he said. “In the mid-1990′s I heard stories that it was becoming more difficult for field crews to find ‘good’ ice to put camps on.” The second clue was that Inupiat Eskimo elders in Barrow, Alaska, had “for years been telling researchers that they have seen less of this type of thick, old ice near the coast,” Maslanik explained.
To help unravel the full story these clues hinted at, several years ago Fowler determined how to track ice’s age using a combination of different types of satellite data along with drifting buoy data from the International Arctic Buoy Program. “Most of the sea ice cover drifts with winds and ocean currents, traveling typically between a few hundred meters to tens of kilometers per day,” Maslanik said. “Using satellite imagery, the direction and speed of this drift can be tracked from day to day, starting with satellite data that was first collected in 1978 and continuing through to the present day.”
The scientists improve this “drift vector” data set by combining it with drift information provided by GPS-tracked buoys present in the Arctic to reproduce the particular tracks areas of ice have drifted along. “To create our ice age product from these tracks, they are combined with other satellite data that show when areas of the ocean become mostly ice free due to summer melt,” Maslanik said. “If the ice along a particular track survives, then that area is coded as having aged an additional year.”
The big picture
The oldest ice has recovered slightly since the record minimum sea-ice area in 2007, and the Colorado team now hopes to see whether this is enough to help re-establish some of the Arctic ice more permanently. However, lower levels of older ice raises the threat to what remains. “The loss of the older, thicker ice makes the Arctic more vulnerable to individual, extreme years such as 2007 and less able to recover following those extreme years,” Maslanik said.

The amount of Arctic ice that has survived more than one melt period is 45 per cent of the total ice cover in 2011, down from about 75 per cent in the mid 1980s. Coloured regions show areas more than 15 per cent covered by ice, black regions are covered by less than 15 per cent ice and grey areas are land. Credit: James Maslanik, University of Colorado
The Arctic is the region of the world by far the most dramatically impacted by climate change, and so concentrating only on what is happening there doesn’t give the most balanced picture. Nevertheless, Maslanik underlines that the information that is coming down from the defrosting north helps demonstrate what is going on in the world overall. “For the general public who aren’t directly affected by these changes – at least, not in obvious ways – perhaps the best way of looking at these kinds of results is as yet another part of the big picture that’s being painted by scientists and others, showing how the earth is changing rapidly and globally,” he explained. “What people need to recognize is that our study is just one of thousands, including results from biological studies, ocean chemistry, weather and climate, that are making this picture increasingly clear. If you take the time to look at this picture, it’s hard to reject the conclusion that humans are fundamentally altering our entire planet.”
Comments (0)
You don't have permission to comment on this page.